# Project
The concept of Project is central in Cytomine as most of the data access permission will depend on the related project.
A project is a shared area between a set of users and contains images and their annotations and optionally the results of algorithm executions. Except for the authorized users, a project is always private. No user can access or see your project if you don't explicitly add this user into the member list.
# Main concept
# Contributors & managers
Users in a project are divided into two categories:
- A project CONTRIBUTOR is a user which has access to the project, but cannot add images in this project, nor manage the configuration of the project. Allowed actions like annotating images, are determined by the editing mode of the project.
- A project MANAGER is a project contributor with extended rights. It can add images and manages the project, i.e. has rights to change the project configuration, to add new users to a project (as contributor or manager) or to delete the project itself. The user who creates a project is a project manager by default.
One or several project managers can be set as representatives. They are project managers with first line support responsibility for the project.
# Member permissions
You can modify your project configuration to determine the permission of the members of your project. These configurations will allow blind mode for image analysis, teaching project with students and teachers or even a more collaborative configuration used by professional teams.
The following documentation will presume a full collaborative project.
See the configuration part below for more information.
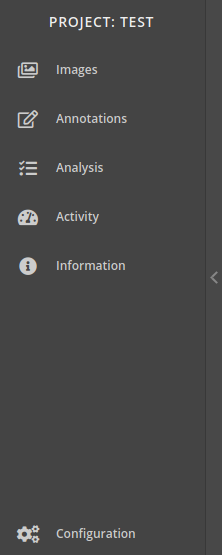
# Project navigation bar
In a project, you will have a project navigation bar to browse through the different panels of the project.
# Image list
The Images panel contains the list of the images currently in the project and allows you to add new images.
This project contains only 1 image whose characteristics are listed. Image "palm_skin.tiff" already contains 1 annotation made by a contributor.
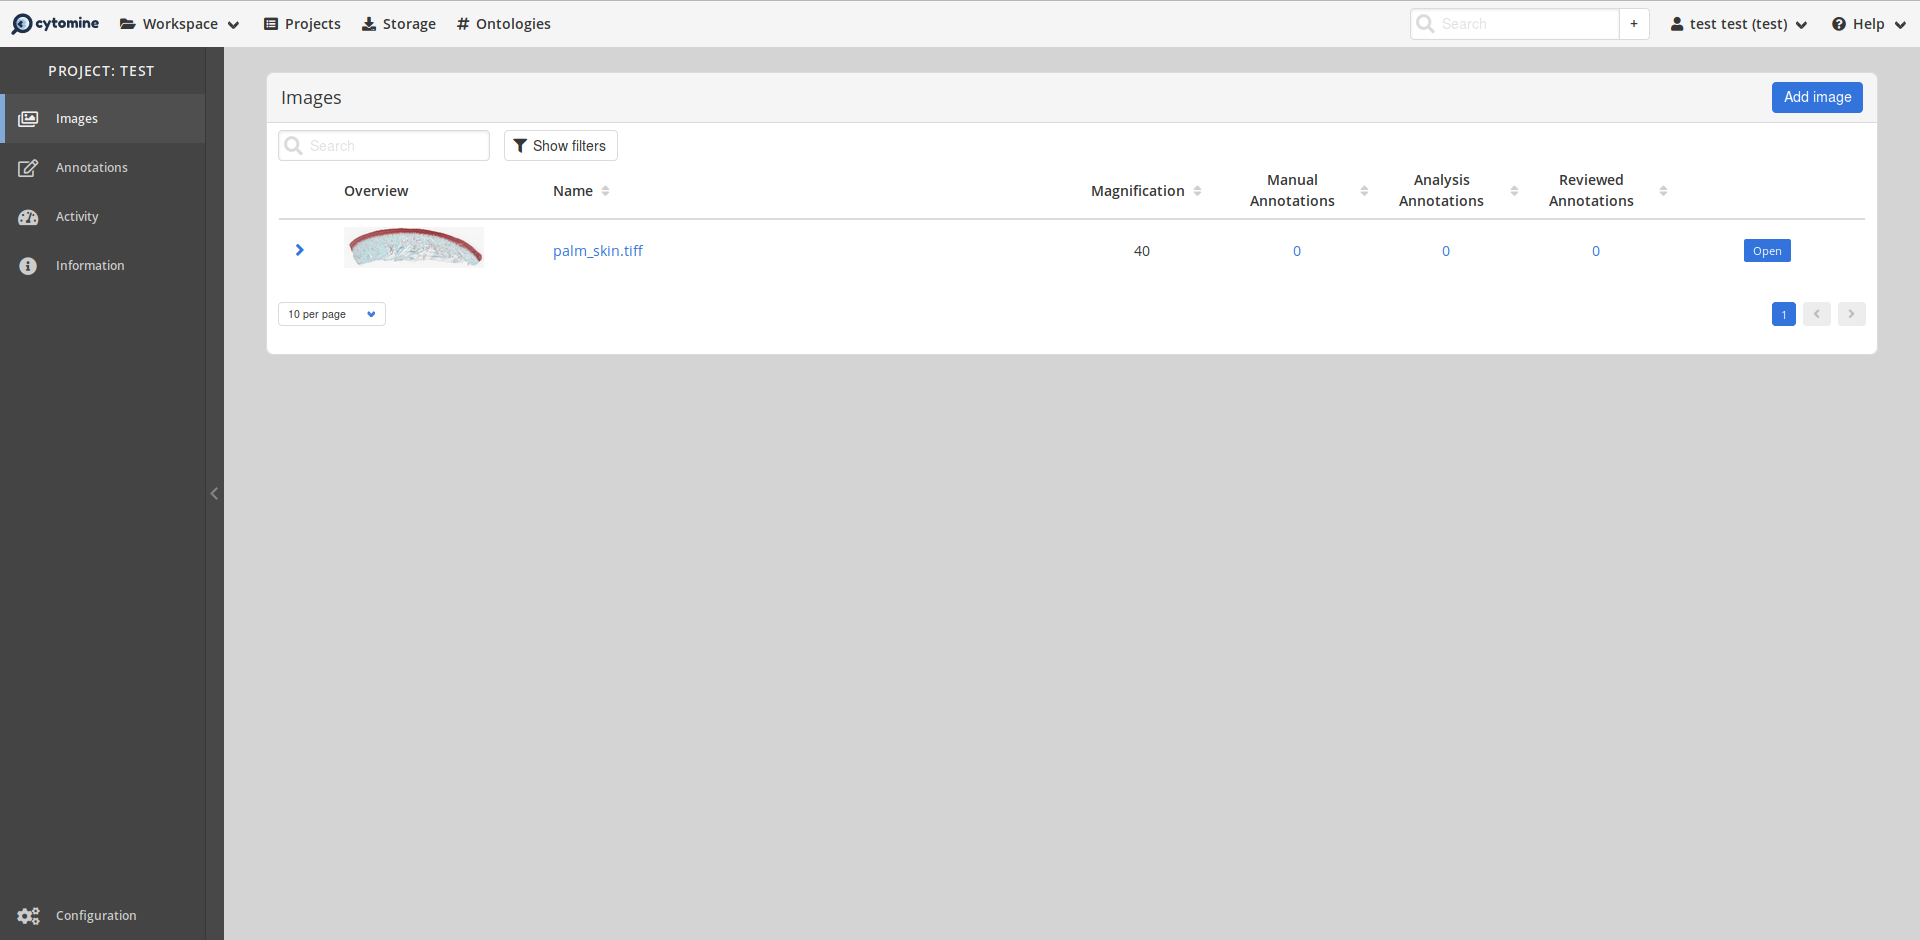
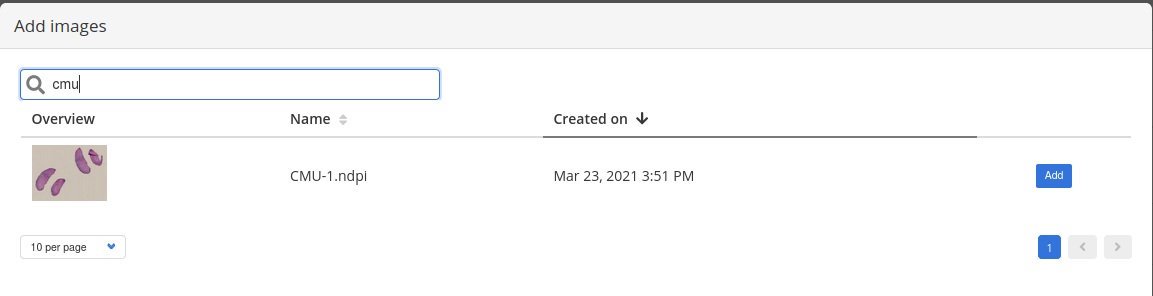
To add a new image, click on the Add image button at the top right of the panel.
and choose in the list a previously uploaded image to add in your project by clicking on the Add button.
In the image list, the arrow at the left of each line gives access to supplementary information and operations (e.g. download the image, describe it, ...).
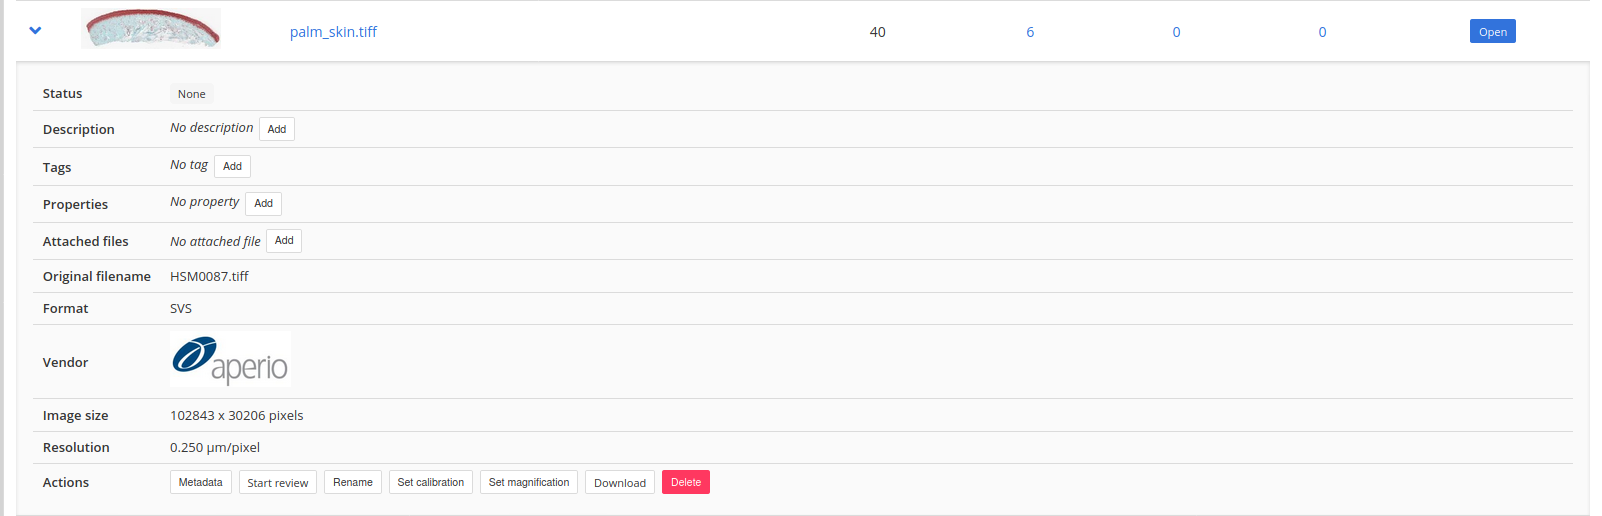
One can open the image by clicking on its thumbnail or on the blue Open button at the right of the line. The explore view is then displayed.
You will find the documentation dedicated to the image viewer on a dedicated page.
# Annotations
The annotation panel will give a list of all the annotations made in the project with filters on the contributors, the images and the terms. The corresponding annotations are displayed in squared boxes.
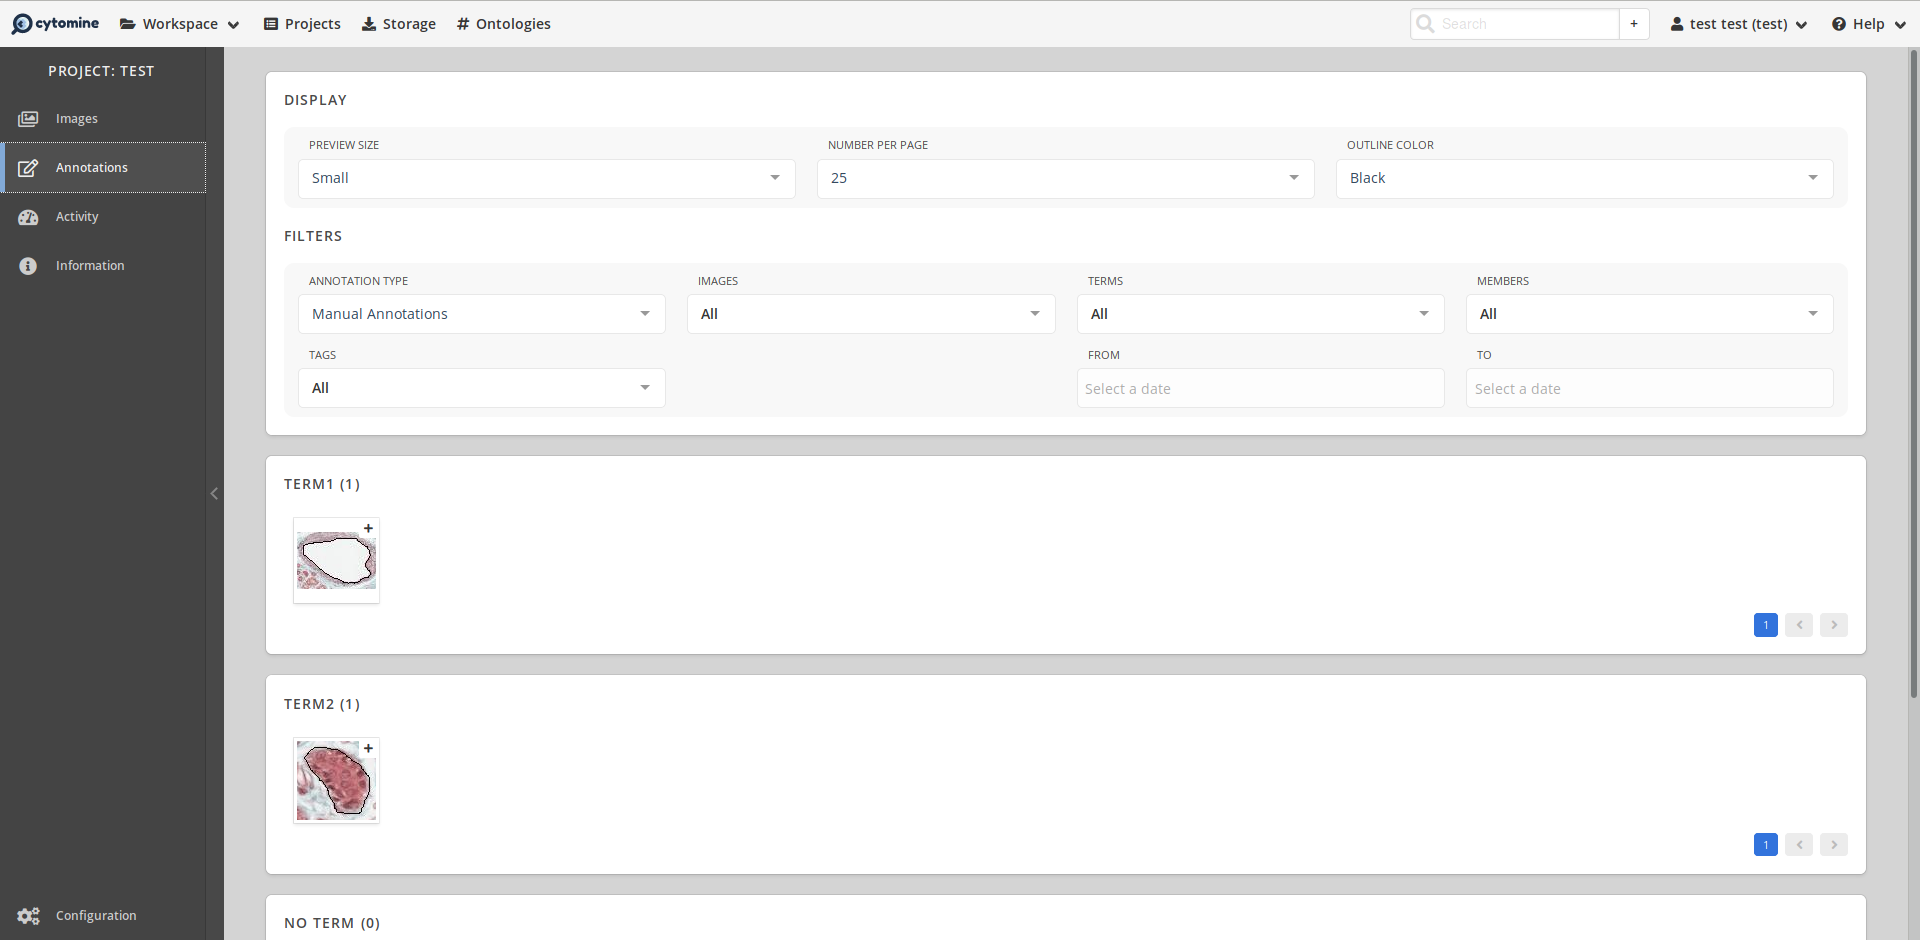
and the information box associated to this annotation can be displayed by clicking on the + icon.
If you click in a box, you will be redirected to the image viewer at the right zoom & location to see the selected annotation.
More information on the dedicated page.
# Activity
In this panel, you will find tabs with graphs and data related to the activity of the project and its members.
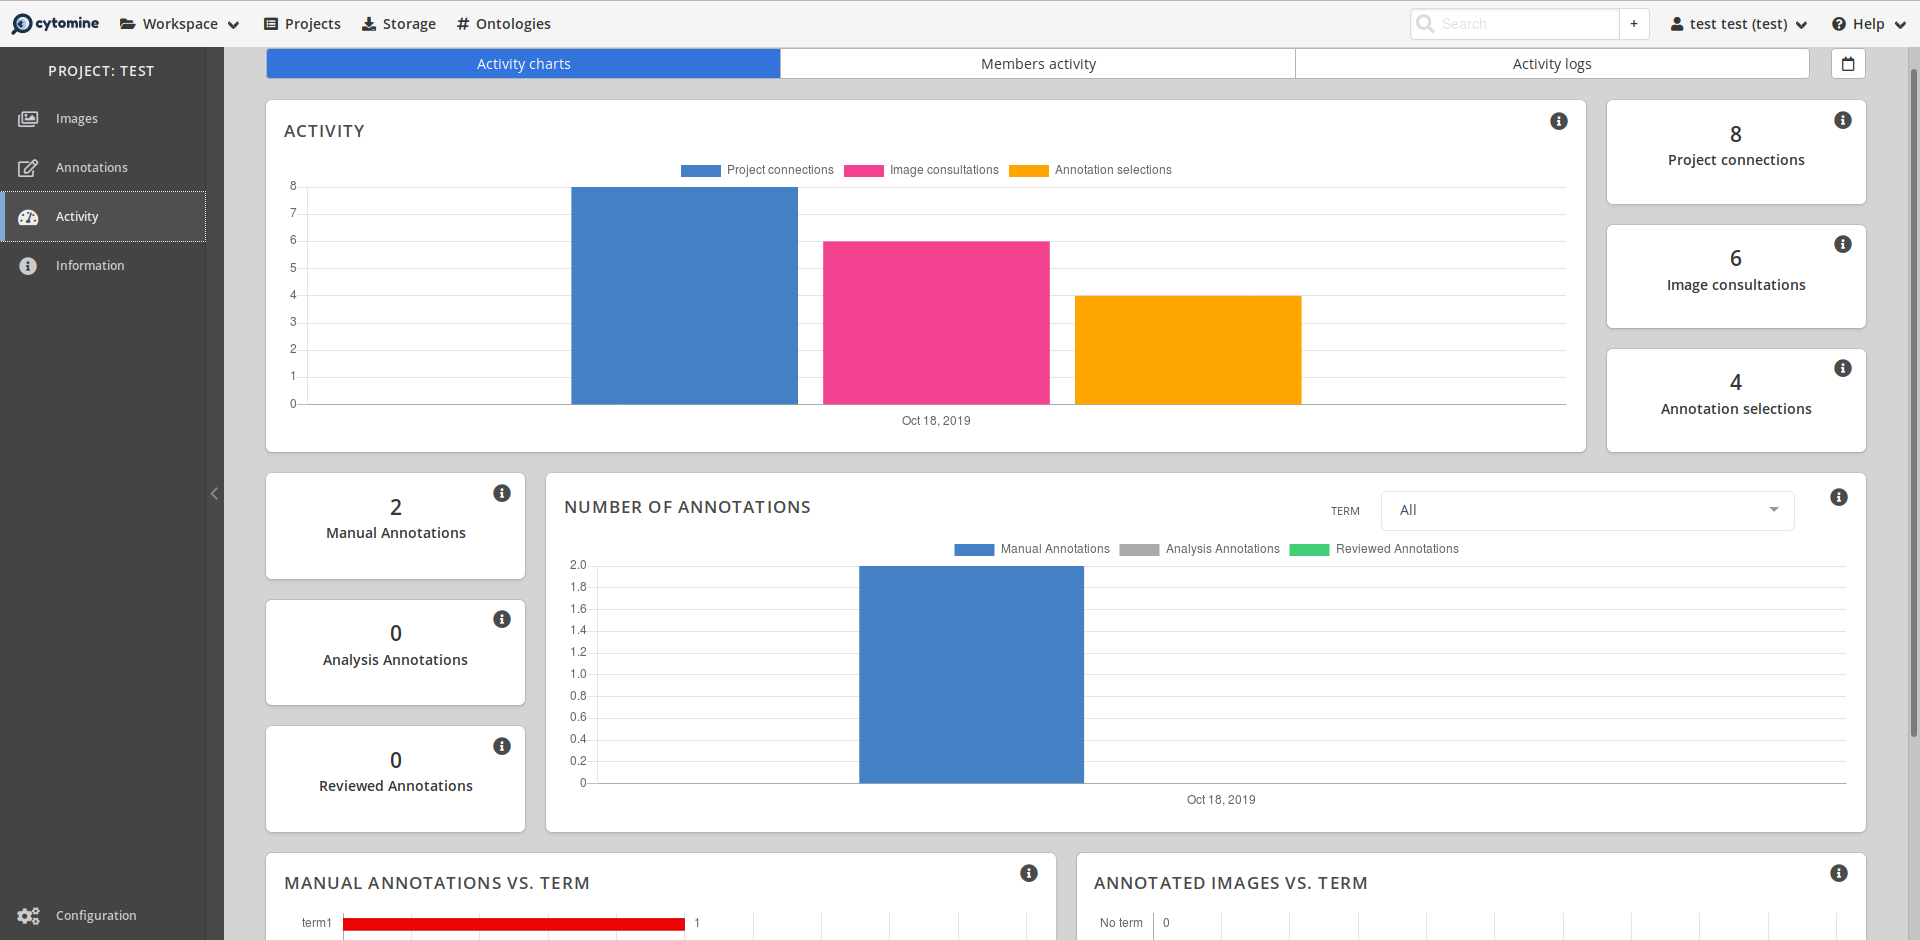
# Activity charts
On this tab, all the activity data will be rendered as charts: number of connections, number of annotations created by users, etc.
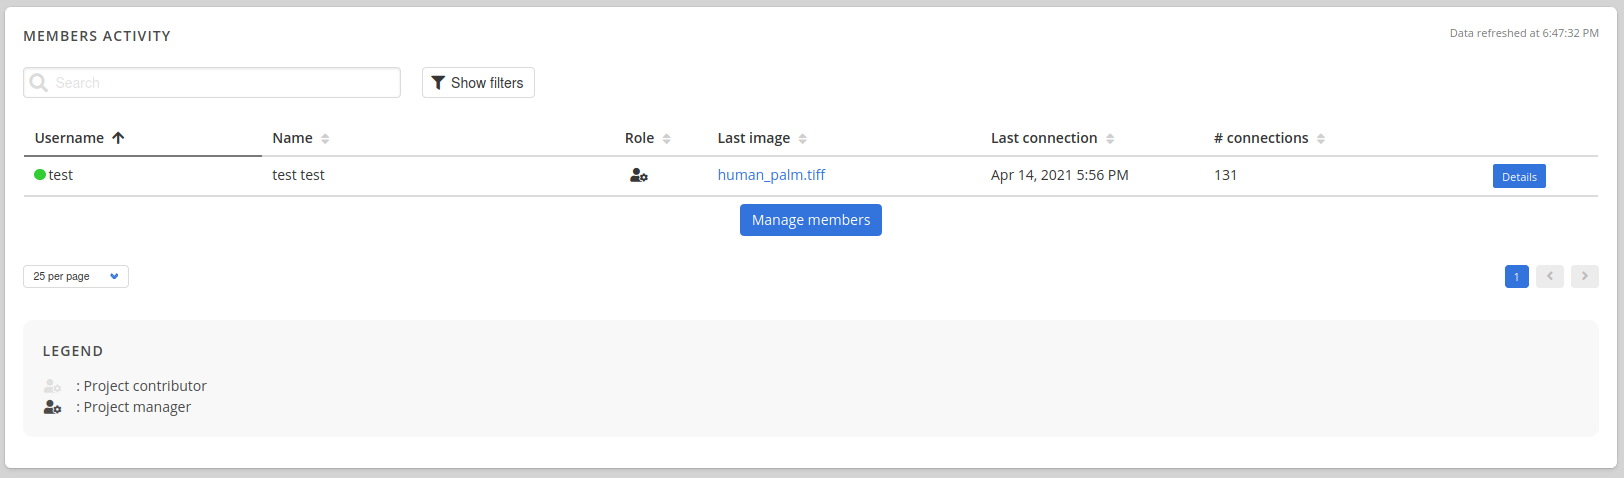
# Members activity
On this tab, you will get a list of the project members and their activity information: status (online or not), last viewed image, last connections, image consultations by connections, etc.
# Activity logs
On this tab, you will get the activity logs of your project.
# Information
This panel will display all information related to the project.
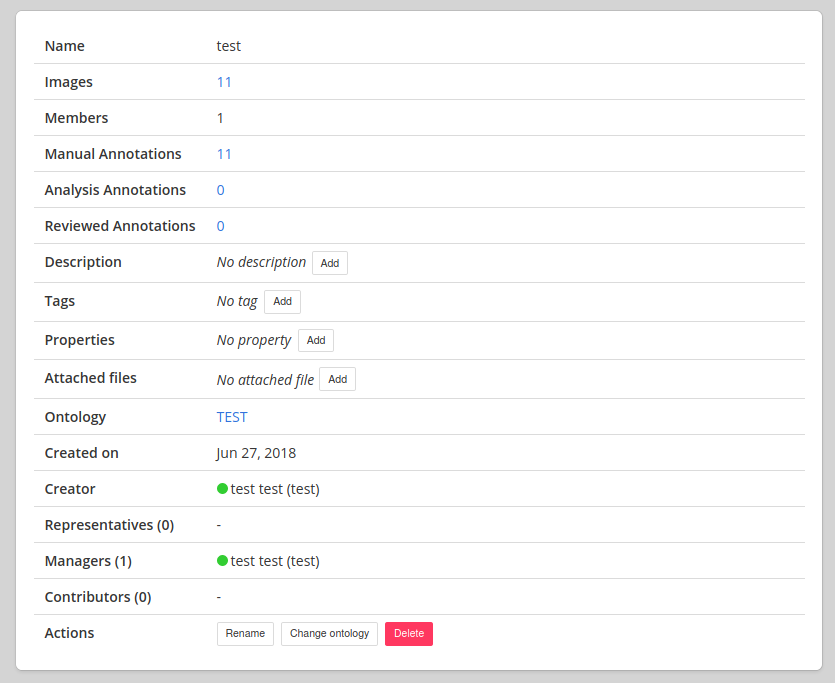
By clicking on the ontology name, you will open the Ontology panel. Ontology is one of the key concept of Cytomine. Each project has a single ontology. It can be either an existing ontology (it can be associated with the project when a user creates it) or a new ontology that can be edited online.
You will find more information on the ontology page.
# Configuration
Each project can be configured through the Configuration panel. Managers of a project can configure all the following options:
General Configuration: Name of the project, show or hide the layers of managers & contributors, change the Editing mode, enable/disable the blind mode, choose to display an annotation layer or a property by default.
Members Configuration: In this panel, you will be able to add a contributor, a manager or a representative of this project.
Custom UI Configuration: In this panel, you will see two columns of buttons. The first one is related to the manager permissions in this project and the second one is related to the contributors permissions.
If, in the line Overview Panel, the button of the first row is green, it means that the Overview Panel will be shown to the managers of this project.
If the button is red, the panel will not be shown. These buttons are split into 4 categories:- Project sidebar contains the tabs of the project navigation bar (at the left of the screen).
- Viewer panel contains the tabs of the image navigation bar (displayed at the right of the screen when you browse an image).
- Annotation details contain the information displayed when you display the info box of an annotation.
- Draw tools contain the tools that can be used to create and interact with the annotations.
Image Filters: This panel lists the image filters that can be applied on the image to be displayed.
# Editing mode
Editing mode will change authorizations of contributors. In any case, project managers are able to see, add, edit or delete data of the project. The possible editing modes are:
- Fully collaborative (formerly known as Classic): project contributors are able to add, edit or delete project data including annotations, properties, descriptions added by other contributors or managers.
- Restricted: project contributors are able to add, edit or delete project data including annotations, properties, descriptions they have created.
- Read-only: project contributors cannot add, edit or delete project data including annotations, properties and description, even the ones they have created.
Another common configuration is the Blind mode: This mode will hide (for contributors) the names of the image in all the panels of the project so that the user quantifying experimental outcomes is blinded to the experimental setting that might appear in original filenames. This mode also hides user activities and annotation statistics and might be used to reduce bias in analyzing imaging data.